Summarizing 51 Years of Landsat Data
BigQuery, a cloud platform for storing and analyzing big tabular datasets, was added as an export option in Earth Engine last year, and I’ve been looking for an excuse to test it out ever since. It’s hard to get a clear idea of capability and cost just from running tutorials and reading pricing tables, so after some brainstorming I settled on a quick weekend project:
Let’s count every cloudless Landsat scene in the Earth Engine catalog to see how data coverage has evolved over 51 years. In the process, I hoped to figure out 1) whether BigQuery was something I would actually use, and 2) how much it would cost me to run.
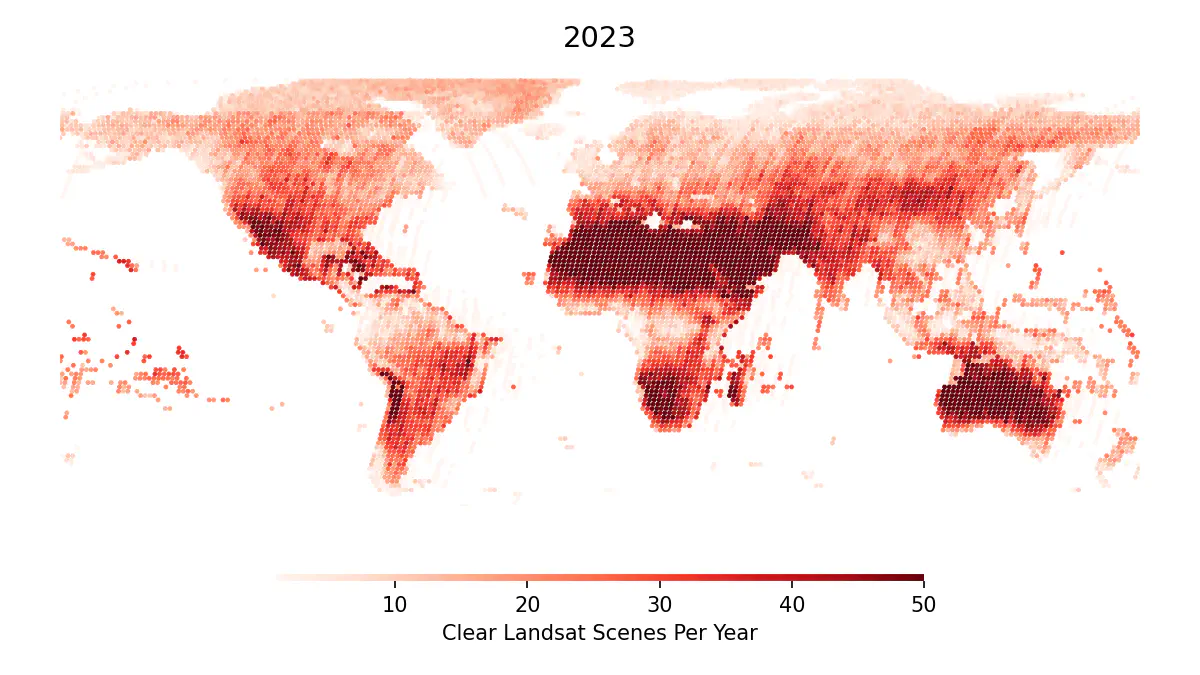
A preview of the final data, showing the count of clear Landsat scenes by path and row in 2023.
The Dataset
Landsat 1 was launched in 1972, and the program has been collecting uninterrupted data on Earth’s surface ever since. Eight Landsat satellites1 have orbited Earth over that period, sometimes alone, but more often than not in constellation with another subsequent launch. This series of overlapping missions has created a stream of data that ebbs and flows as old satellites are decommisioned and new satellites are launched.
To analyze that stream of data in BigQuery, I needed to build a database with metadata for every available Landsat scene.
The Database
Taking advantage of the Earth Engine data catalog, I wrote some quick code to load every scene from every Landsat mission2 into one monster image collection, then extract centroids and metadata into a feature collection that can be exported to BigQuery.
The export process required a little setup on the BigQuery side, but otherwise looked like any other table export in Earth Engine. You can read the official export guide here, but the basic steps were:
- Set up a cloud project with billing info3.
- Create an empty BigQuery dataset in the project to store the exported table.
- Export the collection to a new table in the dataset with
Export.table.toBigQuery.
About 3 hours later, I had a new table in BigQuery with the location and metadata for every available Landsat scene since 1972, and was ready to start analyzing.
Big Queries
BigQuery analysis is done via SQL queries that you can run either in the web UI or through an API. I opted for the latter, and after a little setup was ready to submit my first query.
Counting Scenes
Let’s start simple: How many total scenes are in our table?
SELECT
    COUNT(*) as num_scenes
FROM
    `project.dataset.table_id`
10,923,194: almost 11 million unique scenes.
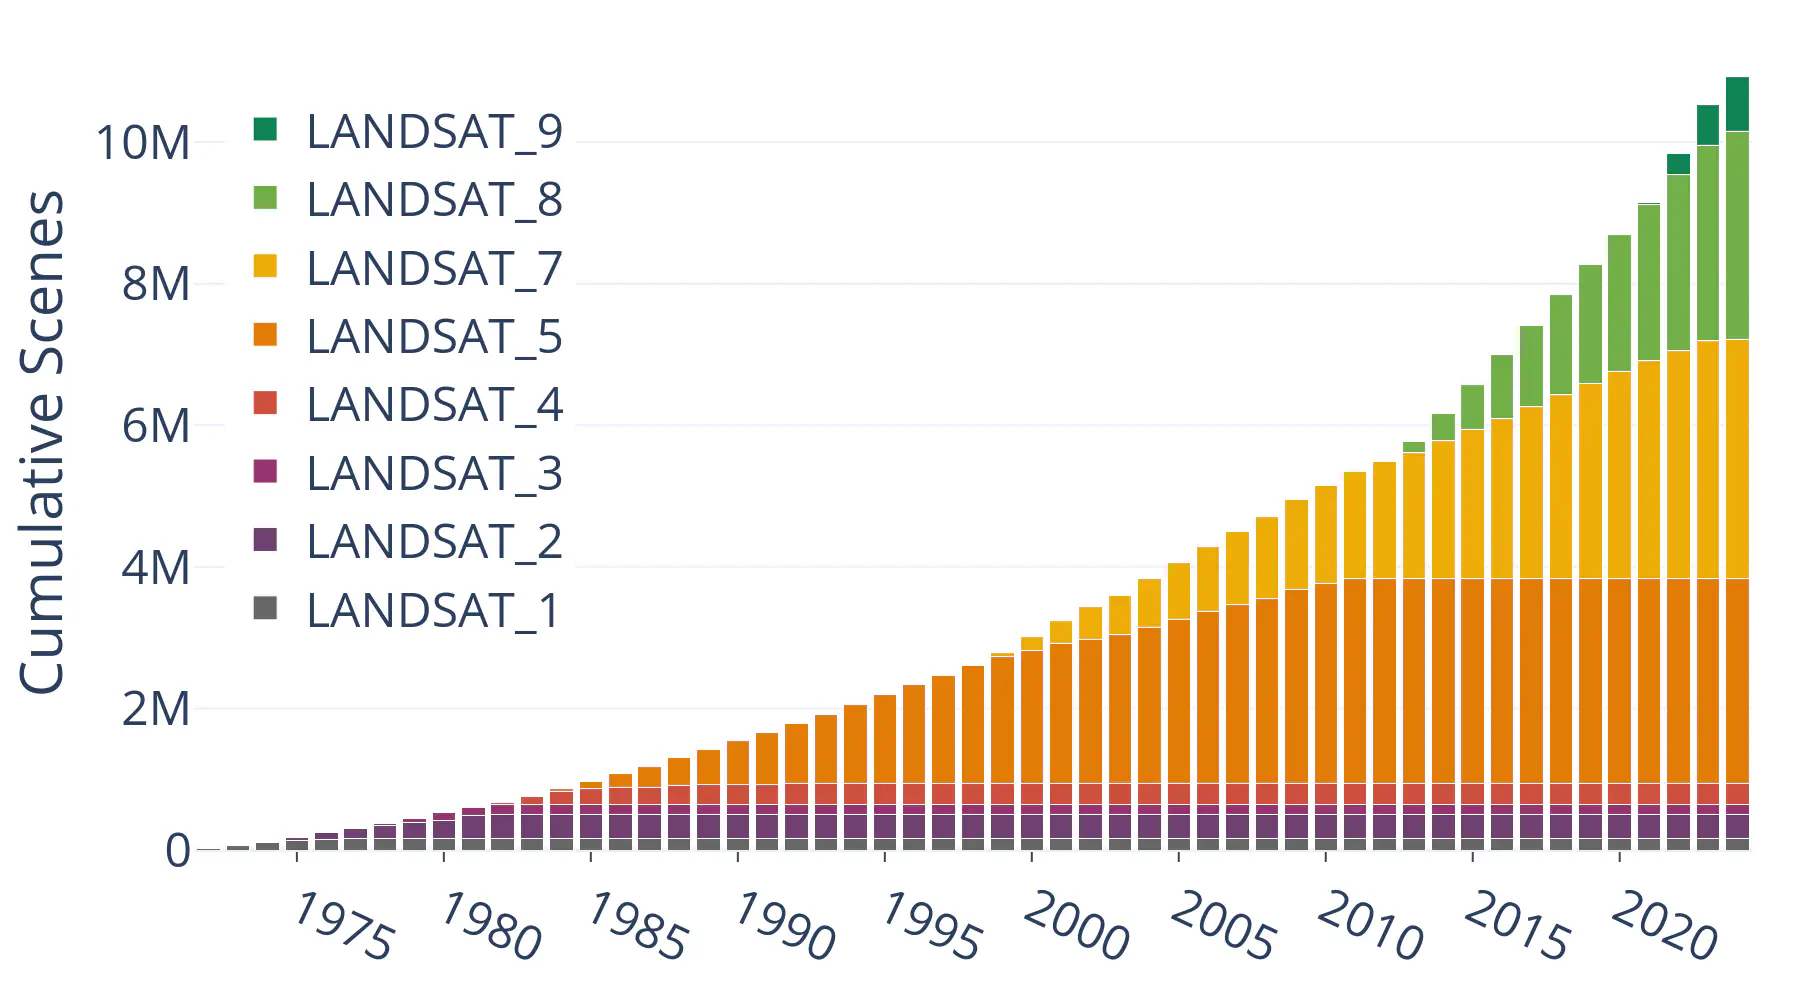
Cumulative Scenes
Next, I broke it down into cumulative scene counts by year and satellite, using the following query (with a little postprocessing in Pandas):
-- Count the number of scenes acquired by each spacecraft in each year
WITH year_count AS (
  SELECT
    SPACECRAFT_ID,
    EXTRACT(YEAR FROM PARSE_DATE('%Y-%m-%d', DATE_ACQUIRED)) AS year_acquired,
    COUNT(*) AS scenes
  FROM
    `project.dataset.table_id`
  GROUP BY
    SPACECRAFT_ID, year_acquired
)
SELECT
  SPACECRAFT_ID,
  year_acquired,
  -- Calculate cumulative scenes by year and spacecraft
  SUM(scenes) OVER (
    PARTITION BY SPACECRAFT_ID
    ORDER BY year_acquired
    ROWS BETWEEN UNBOUNDED PRECEDING AND CURRENT ROW
  ) AS cumulative_count
FROM
  year_count
ORDER BY
  SPACECRAFT_ID, year_acquired
The result is a fascinating look at the contribution of each mission to the Landsat archive, and a testament to the engineering that goes into collecting an unbroken 50-year global dataset from space.
Visualizing Data Coverage
Finally, I looked at where scenes were collected based on their path and row, filtering by cloud cover to focus on usable coverage4.
SELECT
    -- Parse the year of each scene
    EXTRACT(YEAR FROM PARSE_DATE('%Y-%m-%d', DATE_ACQUIRED)) AS year_acquired,
    -- Record the position in the Landsat WRS grid
    WRS_PATH, WRS_ROW,
    -- Count the number of scenes in each group
    COUNT(*) AS num_scenes,
    -- Get the centroid of all scenes in each path/row
    ST_CENTROID(ST_UNION_AGG(geo)) AS geo
FROM
    `project.dataset.table_id`
WHERE
    -- Exclude ocean scenes
    CLOUD_COVER_LAND <> -1
    -- Exclude night scenes
    AND SUN_ELEVATION > 0
    -- Exclude cloudy scenes
    AND CLOUD_COVER_LAND < 20
GROUP BY
    year_acquired, WRS_PATH, WRS_ROW
The query cost $0.006 USD and took 23 seconds to run. And the result, showing the annual count of every cloudless Landsat scene by path and row, since 1972:
Is BigQuery Worth Using?
With the analysis complete, I turned back to the broader question that I started with: as an Earth Engine user, is BigQuery worth adding to your toolbox? To answer that, it’s worth considering 1) the cost and 2) other alternatives.
The Cost
Over the course of this project, I processed a total of 23 GiB of data and stored 1.4 GiB. Even with a lot of inefficient exploratory querying, that only accounts for about 2% of the free monthly quota. Without that allowance, the project would have cost about $0.16 USD5.
Another cost is time and effort. Setting up a BigQuery dataset and learning the interface is a pretty minor one-time cost, but writing effective queries will take time and practice, especially if like me, you don’t write a lot of SQL.
Alternative Options
Without BigQuery, how would I have run this analysis? Probably either by exporting a massive CSV and processing locally, or by attempting to calculate and export summaries directly from Earth Engine. For a fair comparison, I tried (and failed) to run each of those approaches6.
Local processing in GeoPandas ran for 75 minutes before crashing my laptop. A more powerful machine or a more efficient package like GeoPolars could probably chug through the 10 million rows, but it’s hard to beat the portability and scalability of cloud computing.
Next, I recreated the group-by query with some awkward nested map functions in Earth Engine and tried to export a summary feature collection. Twelve hours later, the task unsurprisingly timed out and failed7. Earth Engine is great for a lot of things, but processing big tabular datasets is not one of them.
Final Thoughts
Starting this project, my biggest concern was the cost of BigQuery. At this scale, that turned out to be a non-issue, as I didn’t come close to exhausting the free monthly quota. I would feel a lot more comfortable with a free, resource-capped research tier, but unless things change, it seems like BigQuery is effectively free for hobby or research use like this.
In terms of capability, BigQuery clearly fills a role that local processing and Earth Engine don’t (even ignoring features that I didn’t test like appending to existing tables, geospatial querying, or built-in machine learning). If you work on very large tabular datasets that interface with Earth Engine, it’s definitely worth a closer look.
You can find the full source code for this project on Github.
Almost nine, but unfortunately Landsat 6 failed to reach orbit due to a catastrophic failure in the fuel system shortly after launch. ↩︎
I grabbed Tier 1 and 2 from Collection 2 for each Landsat mission, and went with raw scenes since I don’t need processed pixels. ↩︎
If cloud computing bills make you as nervous they do me, I suggest 1) setting a max daily quota that will shut down any queries beyond a threshold, 2) using Table Sampling to run small test queries, and 3) dry-running queries to estimate their costs before you submit them. ↩︎
Of course, scenes with high cloud cover can still be usable if you just grab the clear pixels, but using a cloudy/clear cutoff was the only way to run this analysis at the scene-level instead of the pixel-level. ↩︎
The exports from Earth Engine to BigQuery each took around 10,000 EECU-seconds, which would cost about $1 USD on a commercial license. ↩︎
There are other cloud-based alternatives to BigQuery that I didn’t try. ↩︎
The Earth Engine summary ran for 12 hours and consumed about 36,000 EECU-seconds before it timed out, and would have cost $4 USD on a commercial plan. The same query in BigQuery took 23 seconds and cost half a cent. ↩︎